BPII Analytics
![]()
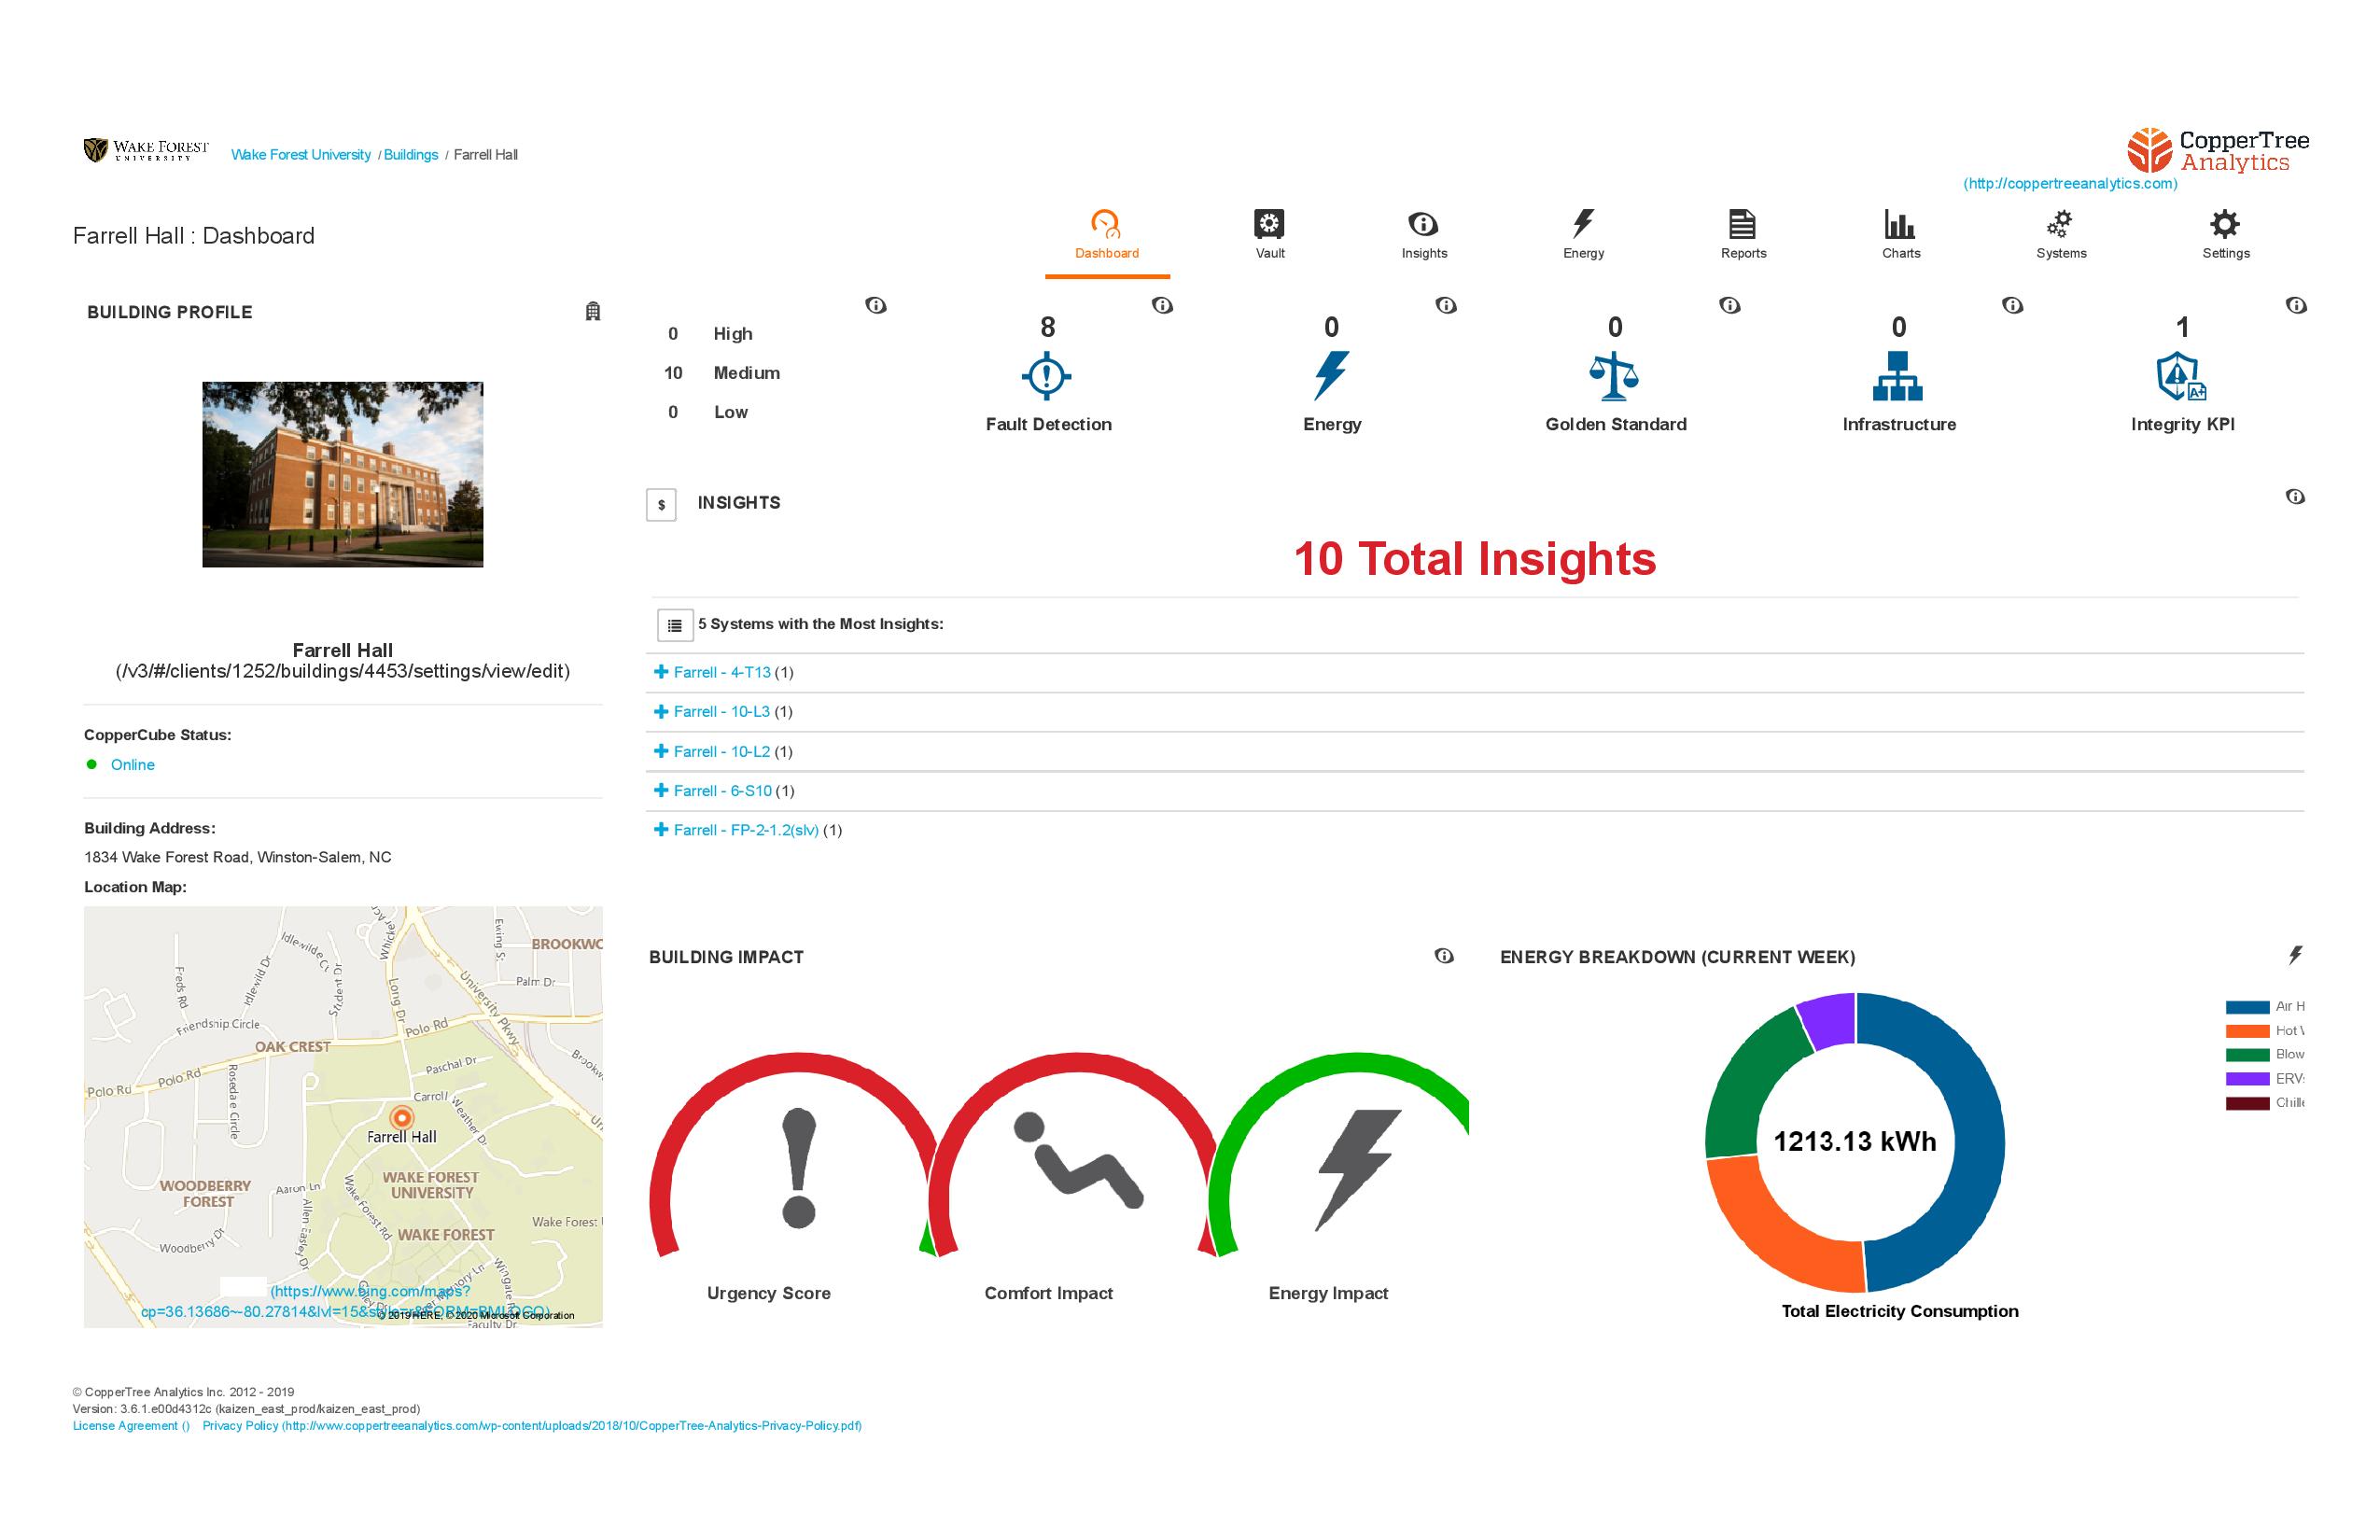
BPI² Analytics has given our team a real look at how utilities in our buildings affect occupants’ experiences every single day. Our analytics initiative started with 10 key buildings where the building automation system (electricity, water, steam, gas, and chilled water meters) sends data to analytics software in real time. The software is able to give us custom insights, providing us with the opportunity to strike a balance between comfort and energy efficiency for our campus.
The software brings in real time data and gives us access to historical data dating back to the summer of 2019. This data is charted automatically against a set of rules which is a series of formulas and filters designed to alert us when they fall, rise, or stay static compared to a baseline of performance. The rules work to give us “insights” to check on in the buildings.
The “insights” we receive come from data points that meet or miss the custom requirements that our rules have set. These insights are then rated based on urgency, comfort level, and energy impact so that we know the order in which we should respond. Some insights have led to issues that may be easily overlooked when manually analyzing data, and some show us areas of opportunity to save more energy.
Within the analytics software, every alert from an insight and building specific analytics overview is accessible through the dashboard. BPI² Analytics software, our custom rules, the insights, and our team’s actions are working together to further the mission of BPI² and make a real difference in the buildings. Instead of reading spreadsheets of data trying to find anomalies, this system runs rules 24/7 to spot data jumps or dips to make us aware of problems earlier. Efficiency in monitoring and finding energy waste.